
I still write a ton of code. Code needs to be maintained. That means keeping an eye on how your code performs. While talking through that process with a friend and a client, I thought it might be interesting to write a bit about my process.
Git is the common thread
I use Gitlab for all my git’ing needs. Gitlab is a full fledged software project management stack, and contains everything from git repos, wikis, CI and much much much. I originally chose Gitlab because I was bootstrapping my business years ago, and it was the easiest way to have infinite private git repos.
I am assuming that you could drop in almost any git server offering out there.
Catch problems before they are deployed
Gitlab CI is a really solid and strong tool. It is equivalent to Github Actions, in case you’re using that. Part of the CI process is linting, testing and security auditing.
I have my Gitlab CI configured to use docker, and it runs off a second hand Intel NUC I have chucked in the back of a cupboard. I run a variety of docker images to do some pre-deployment checks. I try to write solid code, but everyone has a bad day, and these tools help to catch problems before they deploy and become embarrassing. It’s not a failsafe, but just another bit in my toolbox.
The docker images I use are almost exclusively provided by a group called pipelinecomponents, and their repo on Docker Hub is amazing. Because I most often work in PHP and frontend technologies my most used of their containers are:
- eslint; does static analysis of JavaScript, and flags any potential issues
- stylelint; verifies the compiled CSS output and flags deprecated methods and code
- php-linter; runs static analysis on PHP and will validate against specific versions of PHP
- php-security-checker; reviews the contents of composer.json and flags any dependencies that may have been declared insecure
- php-codesniffer; does essentially the same as php-linter, but I am a belt and suspenders kind of guy
… and yet, still …
I have all these tools and still something will fail or break. Maybe I didn’t test for a very specific edgecase? Maybe a scenario cropped up that I hadn’t accounted for? Regardless, the last thing you want is to learn about issues from your users. It is much much better if your code can report on itself when it breaks or fails.
This is where the genius tool known as Sentry comes in. You integrate Sentry into your codebase and it will monitor and report on any abnormalities, including a full stack trace of the failing code.
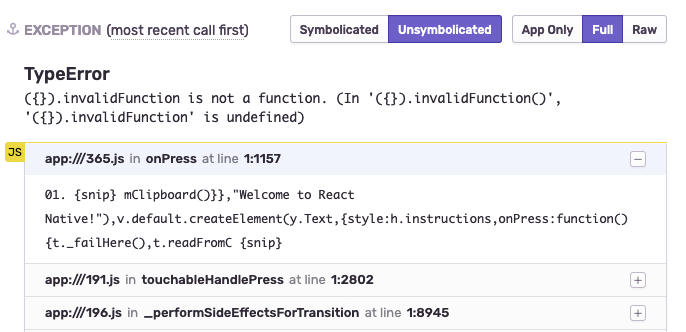
Sentry integrates with Gitlab and vice versa, so every time I deploy new versions all tools are aware of the latest release, and Sentry will automatically flag new bugs to the appropriate release. It will help you track regressions, it will help you identify users, and much much more.
It took me a while to configure and set everything up, but ever since it got set up I have lost count of how many hours this has saved me in debugging and tracing.
This is my pipeline. There are many like it. But this one is mine. Like I said, all of these tools run off of a NUC in cupboard, using Docker.
You can recreate most of the same workflows and automations using a vast variety of tools.